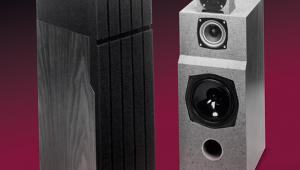
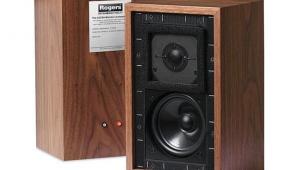
Celestion SL6 Loudspeaker
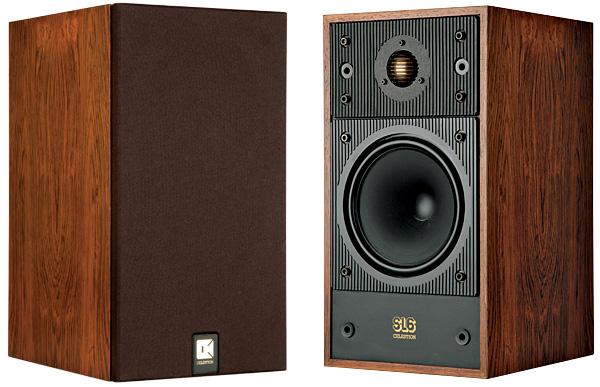
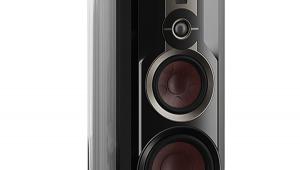
It is no exaggeration to state that the SL6 is one of the most interesting moving-coil speakers to come my way for a long time, and that it embodies significant advances in driver design. Many readers may find this surprising. After all, Celestion has traditionally been associated with the mass end of the market, its reputation justifiably built on product consistency and value-for-money rather than on innovation.
However, it is the companies with a strong market share who are in a position to sink funds into the kind of research projects on which the improvement of the breed depends.

Model Behaviour
A great deal of effort has been devoted to studying the behaviour of moving-coil drivers over the years, using techniques such as mathematical modelling and attempted direct observation of motion. Mathematical models are fine for predicting the effects of intended improvements, but they do depend on the accurate knowledge of all relevant parameters and their values, including non-linear components. Even if all this information is available, and no complicating factor has been overlooked (a likely story!), the results of any computer predictions must be tested by observation.
Until recently, however, physical observation has been limited to very small movements in small areas with reasonable resolution, or larger movements with poor resolution – not really of much use. Lacking detailed observation of physical motion, judgements have been based in the main on anechoic amplitude/frequency responses, and finally on listening tests.
But we all know that while the flatness of the response and the accuracy of the associated sound are certainly quite closely related, they are not completely correlated. Part of the reason for this may be in our heads – stereo perception using two discrete sources is itself a con-trick by which a lot of ears are not fooled. But it does seem likely that the detailed behaviour of the source plays a significant part.
In designing the SL6, Celestion decided to give priority to obtaining the correct vibrational motion from both drivers, arguing that this would get rid of a lot of other complications. To do this it was necessary to see exactly what the drivers were doing, and on a greatly magnified scale.
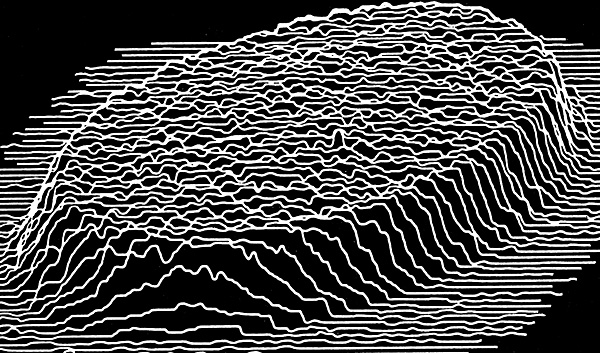
Time To Reflect
The method used to obtain a simulated 3D display showing the shape of a vibrating surface, either stationary or in motion, makes use of optical interferometry. Here, a helium-neon laser beam is split into reference and test beams, the former being frequency-modulated at 5MHz in a Kerr cell. The test beam returns to the interferometer after reflection from the test object and beats with the reference beam in a balanced photodetector.
If the test surface is stationary, the beat frequency is simply 5MHz, but if it is in motion its velocity will give rise to a Doppler frequency shift in the reflected beam, giving a change in the beat frequency, typically of the order of 0.3MHz.
A phase-locked loop produces from the changing beat frequency an output proportional to velocity. The beam scans the test surface linearly at rates of up to 300 per second in the X-direction, and the scan may be stepped in the Y-direction to give a raster of 64 lines. To obtain the displacement of the surface from the velocity represented by the interferometer output, the latter is fed to a phase-sensitive detector for which the reference is one of 12 selectable phases of the audio wave driving the test surface, normally 30o apart. The displacement at a number of points along each scan is then stored for each motional phase.
After all data have been stored they can be used to produce a picture on a 'scope, animated if required, or to produce a hardcopy plot on an X-Y plotter. For a single-line plot, or 'slice' view, 256 points per line are stored for each phase, using ten scans. A complete raster showing the whole surface needs more memory, so the number of points measured on each of the 64 lines is reduced to 64, again at each of 12 phases. Both the single-line and raster displays can be animated at a manually adjustable speed, and the 3D view is isometric. Since velocity is the basic measurement quantity, surfaces appear flat when all parts are at the same velocity – this aids, rather than hinders, interpretation.
Needless to say, the whole process is under the control of a computer, and a full animated 'picture' can be produced in three minutes. Another interesting feature is that isolation from external vibration is made totally unnecessary by the simple addition of a 10Hz-wide low-pass filter at the output of the phase-sensitive detector.
Armed with this very powerful tool, Celestion engineers were able literally to see the problems in driver design, which is the first step in trying to get rid of some of them. Among such problems are the decoupling of parts of the driver surface, the behaviour of dust caps, incorrect termination at surrounds, and the effects of a number of discontinuities such as those produced by coil terminations on the cone surface, and the various glued joints used in manufacture.
Construction
The bass/mid driver for the SL6 was therefore made with a one-piece cone, discarding the conventional dust cap in favour of a concave inner termination, and using a compatible material for the surround, which is welded to the cone with a negligible increase of thickness at the join, and is also higher than usual. The central magnet pole is dished to accommodate the inverted cap, and this has the added advantage of reducing stray flux.
Meanwhile, the back suspension and the coil 'tails' are secured to the neck of the cone at the same level as the coil former, and this symmetry helps to reduce undesired flexural modes. The behaviour of the driver is maintained until well above cut-off to ensure that aberrant modes in the bass driver will not be excited in the tweeter range, which is a problem not always recognised in multi-driver designs.
